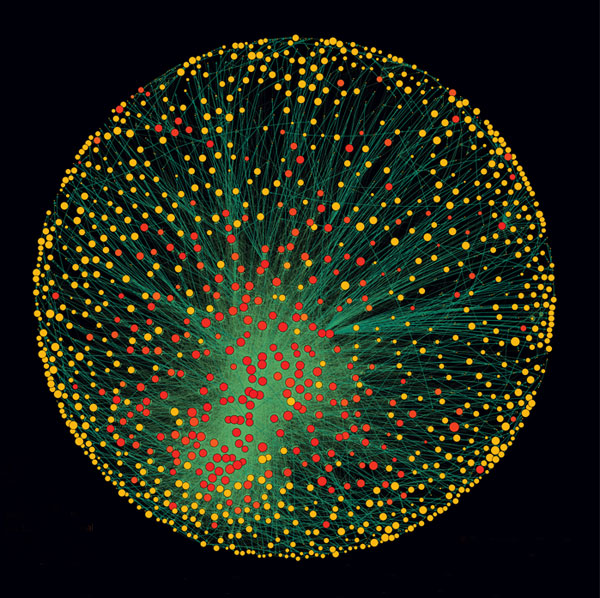
The work, to be published in PloS One, revealed a core of 1318 companies with interlocking ownerships (see image). Each of the 1318 had ties to two or more other companies, and on average they were connected to 20. What’s more, although they represented 20 per cent of global operating revenues, the 1318 appeared to collectively own through their shares the majority of the world’s large blue chip and manufacturing firms – the “real” economy – representing a further 60 per cent of global revenues.
When the team further untangled the web of ownership, it found much of it tracked back to a “super-entity” of 147 even more tightly knit companies – all of their ownership was held by other members of the super-entity – that controlled 40 per cent of the total wealth in the network. “In effect, less than 1 per cent of the companies were able to control 40 per cent of the entire network,” says Glattfelder. Most were financial institutions. The top 20 included Barclays Bank, JPMorgan Chase & Co, and The Goldman Sachs Group.
John Driffill of the University of London, a macroeconomics expert, says the value of the analysis is not just to see if a small number of people controls the global economy, but rather its insights into economic stability.
Concentration of power is not good or bad in itself, says the Zurich team, but the core’s tight interconnections could be. As the world learned in 2008, such networks are unstable. “If one [company] suffers distress,” says Glattfelder, “this propagates.”
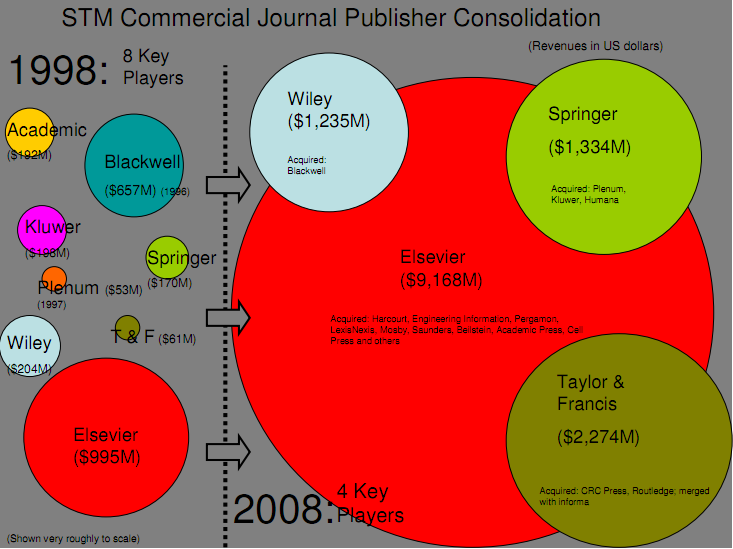
And this, via George Siemens, on the consolidation of commercial journal publishers in the higher education market:

The image is drawn from “A summary of the Federal Research Public Access Act and open access debate” (PDF link), and I recommend you give the summary a look. There are figures that illustrate the growth of expenditures for journal subscriptions at MIT relative to the Consumer Price Index between 1986 and 2006, and the profit margins of the largest journal publishers, and if anything they are even more striking.
I remember that even in 1998 there was talk of a “crisis” in higher education serial publishing. Yet even after a decade of open access activism, and development of many technologies that should have entrenched OA as the de facto standard for scholarly communication, the situation just gets more dire. I’m sure that if similar analyses were applied to public expenditures for learning resources and learning technologies, we’d see similar dismal outcomes.
Higher education justifies its role in society by proclaiming itself as a steward of our cultural heritage and a champion of free inquiry. Yet in the conduct of its own affairs it is shockingly complacent, much to its own detriment. We all have much to be ashamed of.
For a broader and richer discussion, I recommend Jon Beasley-Murray’s keynote at the ACCESS 2011 conference this past week in Vancouver.
Big scary circles | Abject http://t.co/JiHYlRmP via @brlamb
Who owns academic publishing? Effectively, four people. scary stuff from @brlamb http://t.co/XcTYLEZq